City of Brentwood sent me some fill station statistics. After a brief overview, they gave away nearly 4,300,000 gallons of recycled water in 8 weeks. Faster than CCCSD, DSRSD and Ironhouse SD.
They’ve been so successful, they even created this awesome youtube video:
June 2015 Recycled Water Fill Station Stats
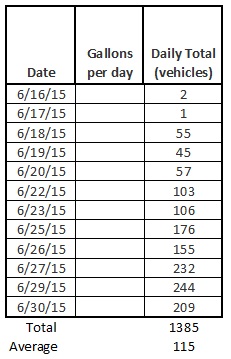 City of Brentwood opened their Residential Recycled Water fill station on June 16th, 2015 with 5 hose bibs. Two vehicles showed up.
The next day, one vehicle showed up. Finally by Thursday June 18th, 2015 word got out and people began to show up in volume. 55 vehicles on the third day, 45 on the fourth and 57 by the fifth. On their 6th day of operation they broke the 100 vehicle per day barrier.
On their 10th day of operation, they broke the 200 vehicle per day barrier. By the end of the month, nearly 1400 vehicles had passed through their fill station to pick up free recycled water.
July 2015 Recycled Water Fill Station Stats
 By July, things really began to take off, so did the data collection. They had seen the demand and doubled the number of hose bibs.
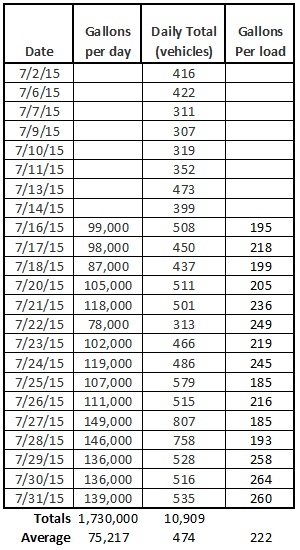
By the second of July, they knew they had given away 281,000 gallons of water, but hadn’t collected the data daily. By the 11th, they had given away over 600,000 gallons but still weren’t collecting daily data.
Starting July 16th, with 508 cars passing through, City of Brentwood gave away 99,000 gallons of water. Each vehicle averaged 195 gallons per load. July 16th was also the first day the surpassed the 500 vehicles per day barrier.
As expected, demand sky rocketed with July 27th being their busiest day with nearly 150,000 gallons given away to just over 800 vehicles.
They tracked 1.73 million gallons given away to nearly 11,000 vehicles.
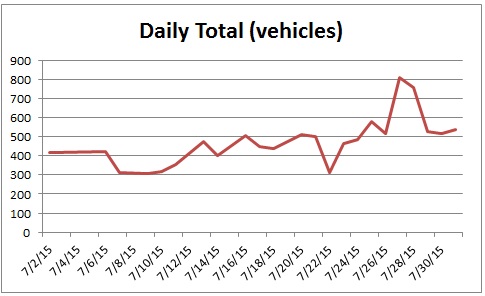
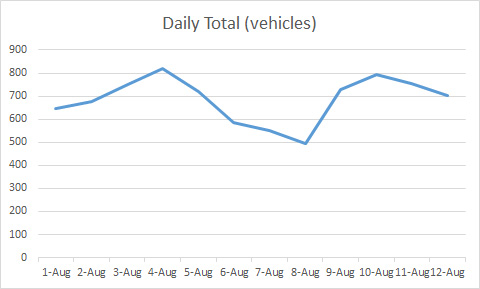
City of Brentwood – July 2015
By the end of July they had acquired enough data to start the chart creation process. Above is the daily total for vehicles. The trend line shows an average near 500 cars per day passing through their facility.
For comparison, Ironhouse Sanitary District in nearby Oakley has only 195 vehicles per day and CCCSD had 458 vehicles per day average in July.
August 2015 Recycled Water Fill Station Stats
 August is just getting started and is showing some strong numbers. Receiving 12 days of stats, they’ve already served over 8,000 vehicles, averaging 685 per day.
Average load sizes are 235 gallons.
At their current trend, they are due to double their total volume taken in the month of August alone, by giving away 4.2 million gallons of water.
Keep up the great work City of Brentwood. Keep me updated when you surpass Dublin San Ramon Services District. 🙂
Below is the raw data chart sent from the City of Brentwood Wastewater Treatment Plant.
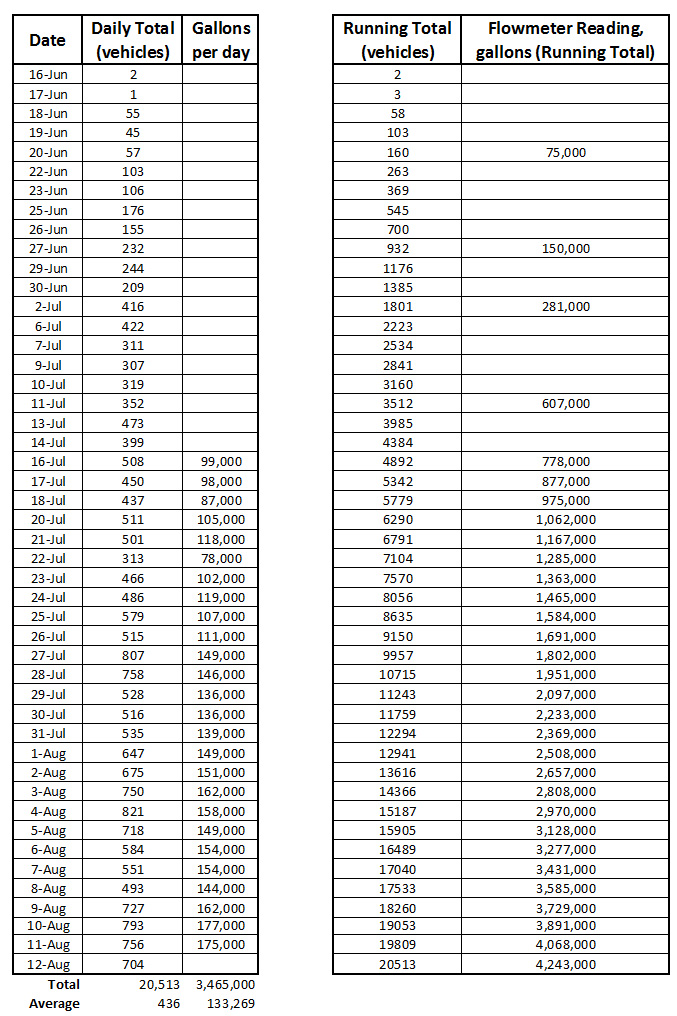
Raw data
I just may need to go for a tour of their facility.
Leave a Reply