
Source: centralsan.org
We’re near the end of another month and people like stats, especially when we’re talking big numbers. Between longer hours, better traffic control and a more efficient way to track fill station usage, CCCSD sure has come a long way from the beginning. Just two weeks ago, if you asked for a data set you could get it that day, but the data was old. Data entry was making the entire process very inefficient.
When the fill station started, expectations were low so all data entry occurred on paper. Up until about the middle of July, everything was done by hand. Now that they’ve written some custom software and acquired a drivers license scanner, data is available in 15 minute increments. Yes, once they get enough data they will know when the busy and slow times are. 🙂
The data charts I received are up to July 28th, 2015. I’ll post the graphics they create, plus some analysis.
Total gallons served: 4,313,000
Total registered users: 1,510
Total visits: 21,408
Average daily gallons: 100,890
Chart Time!
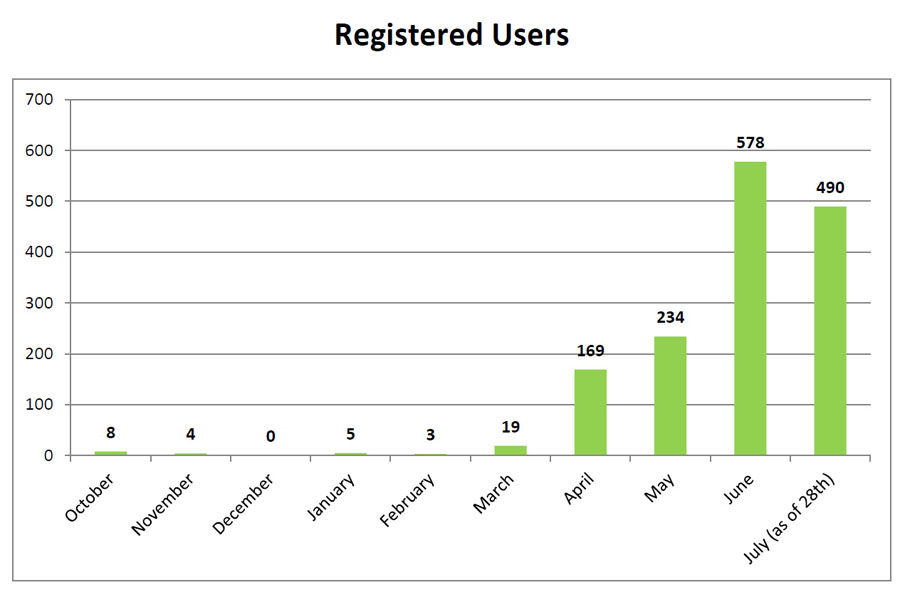
New registered users
The number of new registered users has fallen by 18%. Either we’ve maxed out the number of pick-up trucks in the county, or not enough people know about it. Spread the word!
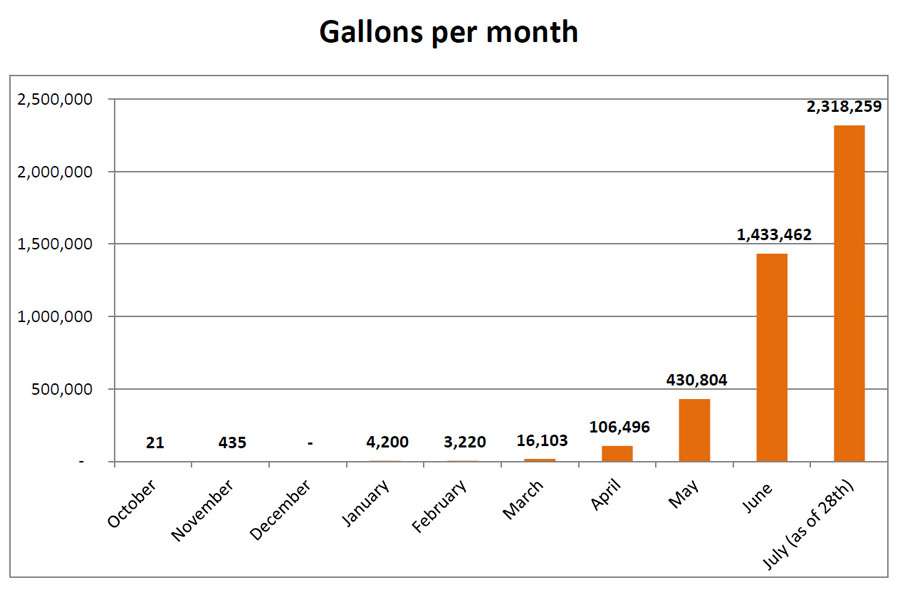
Gallons per month – upto July 28, 2015
Total gallons taken so far is 4,313,000 gallons.
At the end of June, CCCSD had given away 1,994,741 gallons. They gave away 113% more in July than all previous months combined.
When compared to June, 38% more recycled water was hauled away.
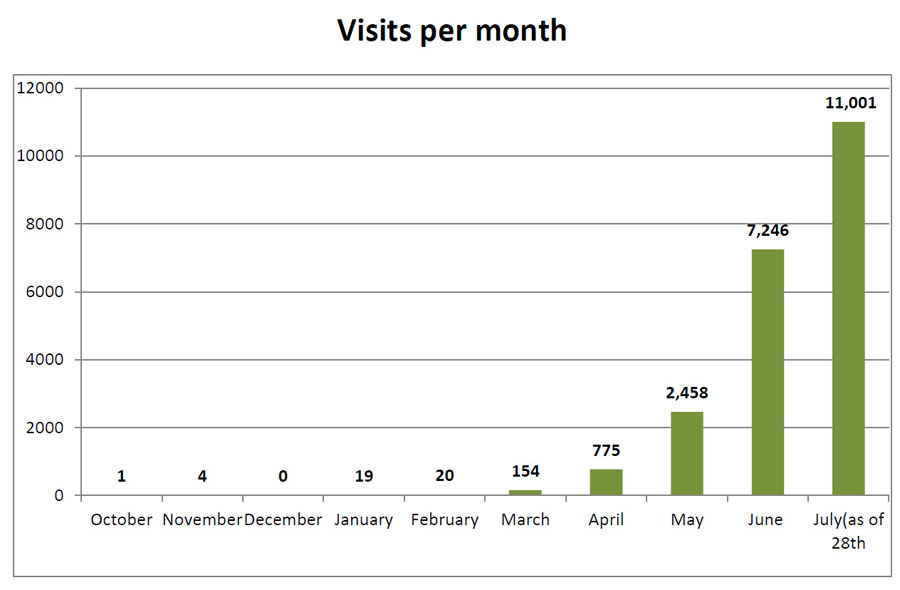
Visits per month
Over 11,000 visitors showed up. Wow! Were you one?
From June to July, this is an increase of 34%.
Amazingly, 21,408 visitors have come through the fill station since it opened. If there are only 1,510 registered users, then on average every registered user has come 14 times.
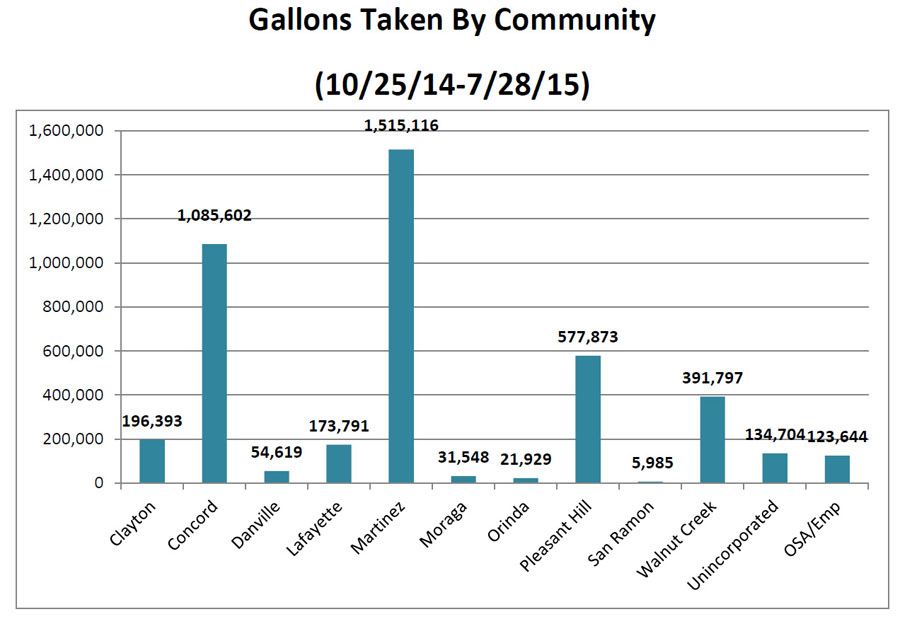
Gallons by community
This is generally the part I like, as it helped me build data for an article “is hauling recycled water economical?”
Since the last time I ran this report – using data from June 24th – employee usage has risen by 78% (96,497 gallons), usage in San Ramon has risen by 72.8% (4,355 gallons) and usage in Orinda, the lowest percent increase on the list has risen by 48.6% (10,665 gallons).
If we look solely at the numbers, Martinez usage has increased by 980,861 gallons (64.7%) and Concord is second best at 735,851 gallons (67.8%).
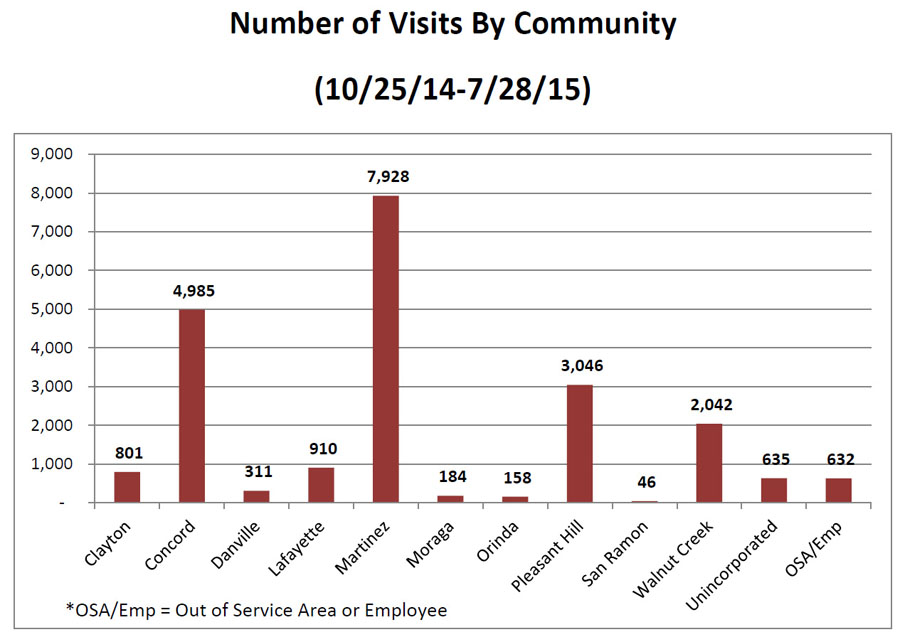
Visits by community
As seen by the number of gallons taken, visitors to the fill station has also increased. Unsurprisingly, Martinez still reigns supreme with nearly 8,000 visits. They’re up over 60% from June with 4,788 more visits. Employee usage is up 71.2% with 450 visits and Lafayette takes up the rear with an almost 54% increase and 490 more trips.
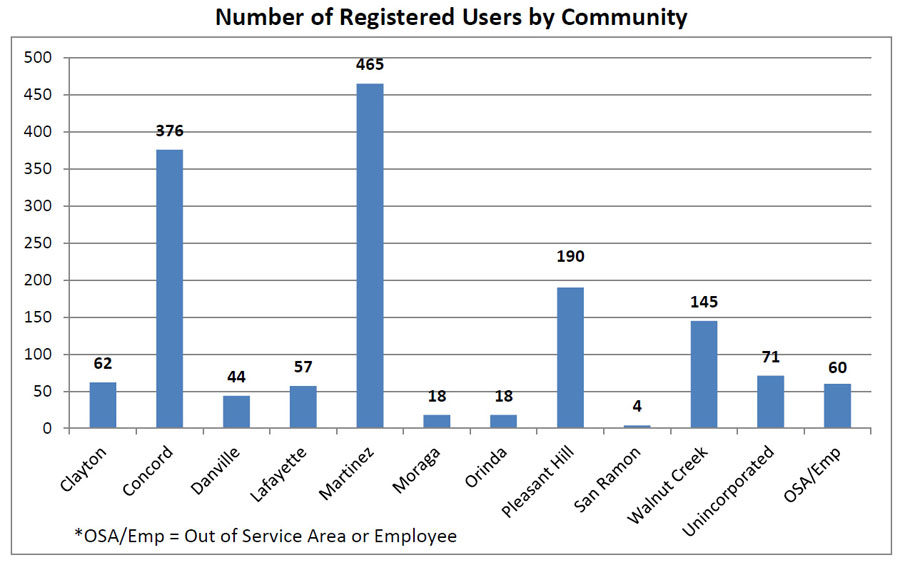
Number Registered by Community
The number of registered users by community increased the most in the City of San Ramon (based upon a percentage of 50%) from 2 people to 4 people.
Lets try this another way. The number of registered users that increased the most (based upon physical people) goes to Concord with 173 new users an increase of 46%. Maybe the Mayor of Concord, Tim Grayson’s article in the newspaper or the numerous posts on Claycord about Recycled Water had something to do with it.
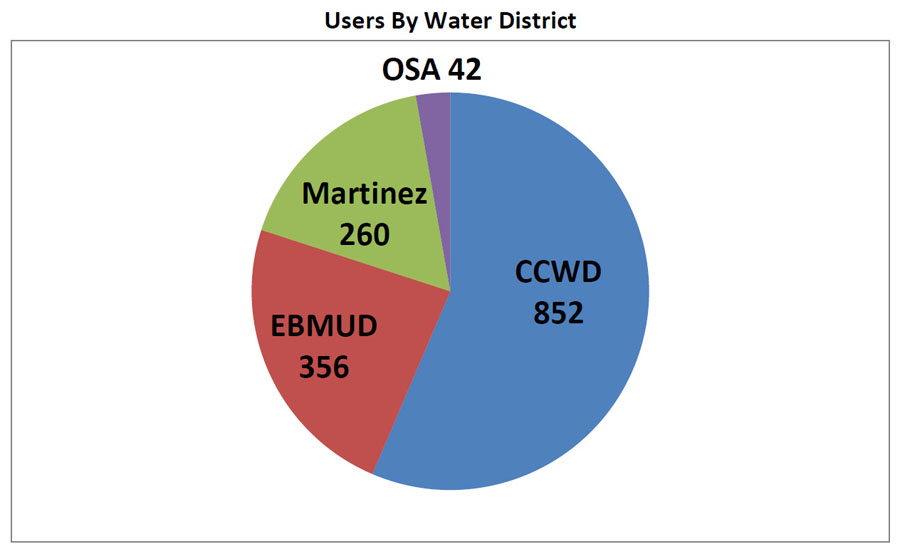
Users by Water District
This last one is a hot topic right now especially with the conservation numbers coming out today. For residents who have Contra Costa Water District drinking water at home, they increased their participation by 38%. Residents living in the East Bay Municipal Utility District service area increased their participation by nearly 27%.
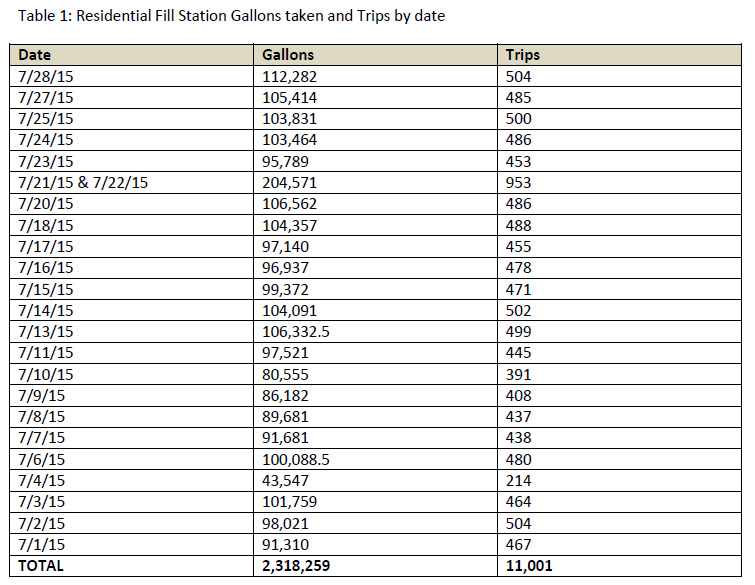
Residential Fill Station Gallons – raw data
Average daily usage hovers around 100,900 gallons. Visitors are averaging 478 trips per day and taking home 211 gallons per trip.
Leave a Reply