
Source: centralsan.org
I was perusing the latest board meeting agenda from July 9, 2015 at the Central Contra Costa Sanitary District website and found some very interesting statistics from their Recycled Water Fill Station.
Much like I posted the other day, CCCSD Fill Station Routes Traffic Along New Route, which included some statistics… now I’ve got bar and pie charts. Fancy spreadsheet madness, probably courtesy of Microsoft Excel!
“CCCSD has the Best [Customer] Service.” – a Danville fill station user
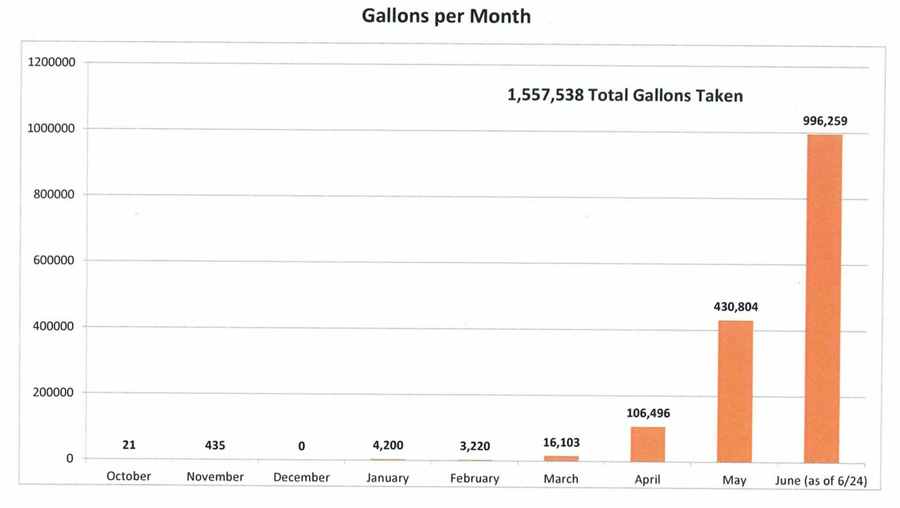
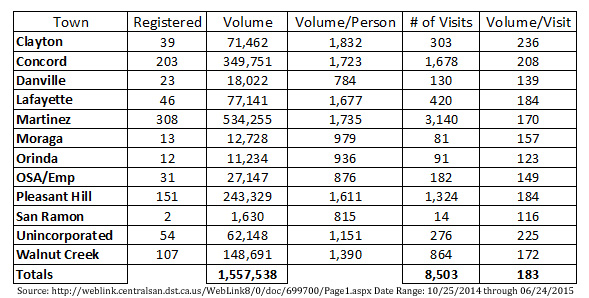
Since CCCSD started their Residential Recycled Water Fill Station, they have given away 1,557,538 gallons of free Recycled Water! WOW!
Source: centralsan.org
Of course, since they’re a “high performance organization” they also broke that data down into several different formats.
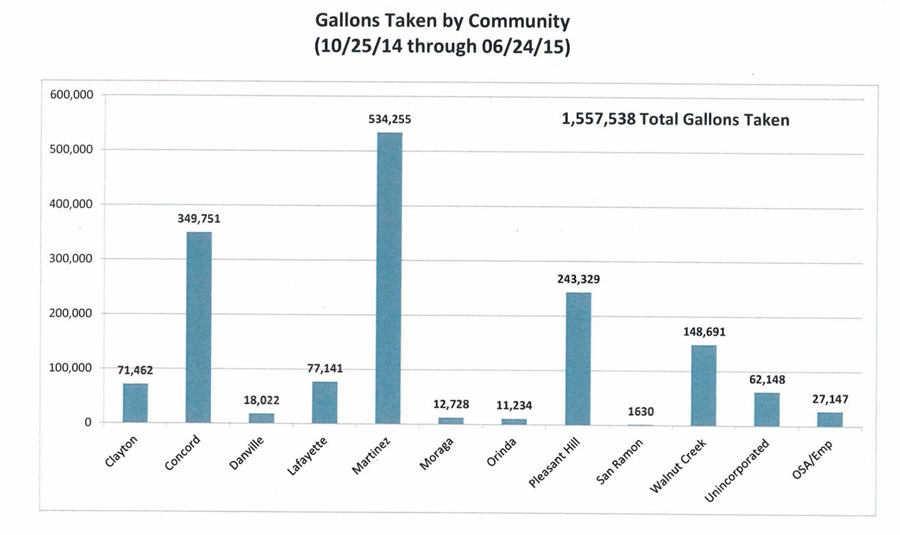
First: Gallons Taken by Community
- San Ramon residents ironically have only taken 1,630 gallons. That makes sense since Dublin San Ramon Services District is just down the street compared to CCCSD which is WAY up the freeway.
- Danville residents has taken 18,022 gallons. All of that might be by a Danville resident who needs 4-5 trips per day to keep his backyard paradise thriving.
- Martinez, the closest community to the fill station has taken more than a half million gallons!
Source: centralsan.org
Second: Registered Users by Community
- I compared the number of Registered Users to Gallons Taken by Community to figure out these numbers.
- Now it makes sense, San Ramon only has 2 registered users, but they took 815 gallons each.
- Danville with its 23 registered users took 18,022 gallons or 783.56 per person.
- Clayton with a relatively low number of registered users but has the highest per person take home of Recycled Water at 1,832 gallons.
- Martinez is a close second at 1,734 gallons.

Source: centralsan.org
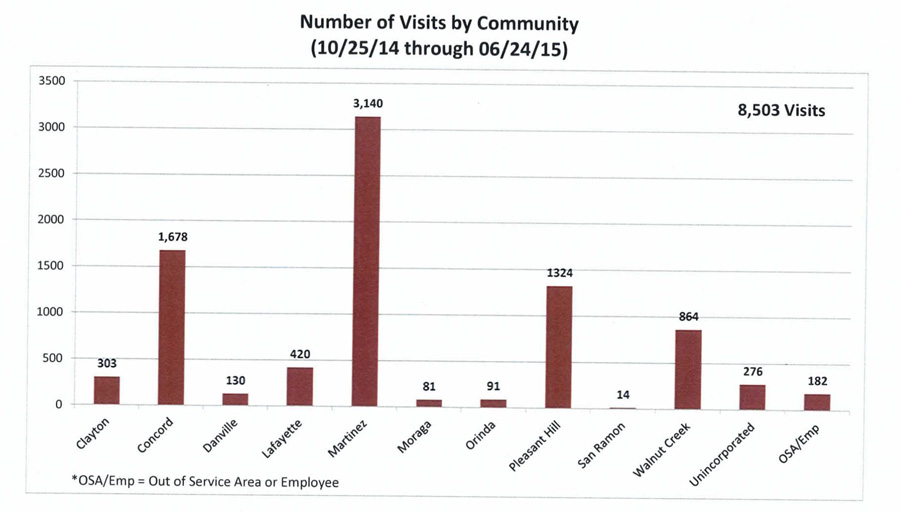
Third: Number of Visits by Community
- I compared Number of Visits to Gallons Taken By Community to figure out these numbers.
- Those 2 registered users in San Ramon have made 14 trips. When that information is compared to their volume taken, each trip they take 116 gallons (or 967 pounds) for the 20 mile trip to the fill station.
- Looks like most employees pick up about 150 gallons per trip. They’re smart to do so, they work there anyways, the trip to the fill station is half the battle.
- Martinez residents take home about 170 gallons per trip.
- Clayton residents, who have to drive 10 miles (with no freeways – all stop lights), take the most home per trip at 235 gallons.
Source: centralsan.org
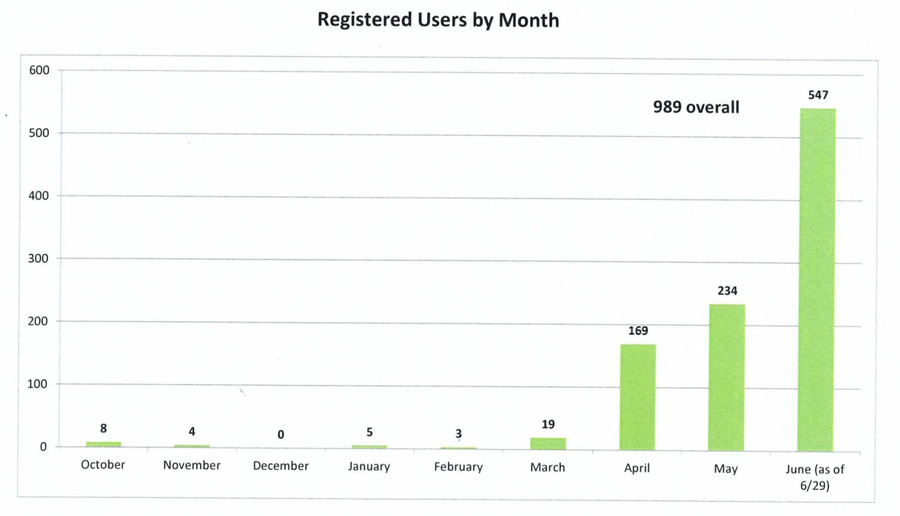
Fourth: Registered Users by Month
- 8 people registered when the fill station first opened in October. Lets assume those are employees.
- In 9 months of operation, 989 people have registered to use the fill station.
- 133% more people registered in June than compared with May.
- 105 more people registered in June than in the previous 8 months, combined. Seems like word is out for sure.
Source: centralsan.org
Fifth: Visits per Month
- Since the fill station opened, 8,503 vehicles have come through to get recycled water.
- On average, 183 gallons is being taken per vehicle, or 1,526.22 pounds of water per trip.
- All these visits requires one thing that Chris Rossiter did say “CCCSD has the best [customer] service.”
- That’s a great point, because as apart of CCCSD’s Vision – “Provide Exceptional Customer Service“. Knocked that one out of the park!

Source: centralsan.org
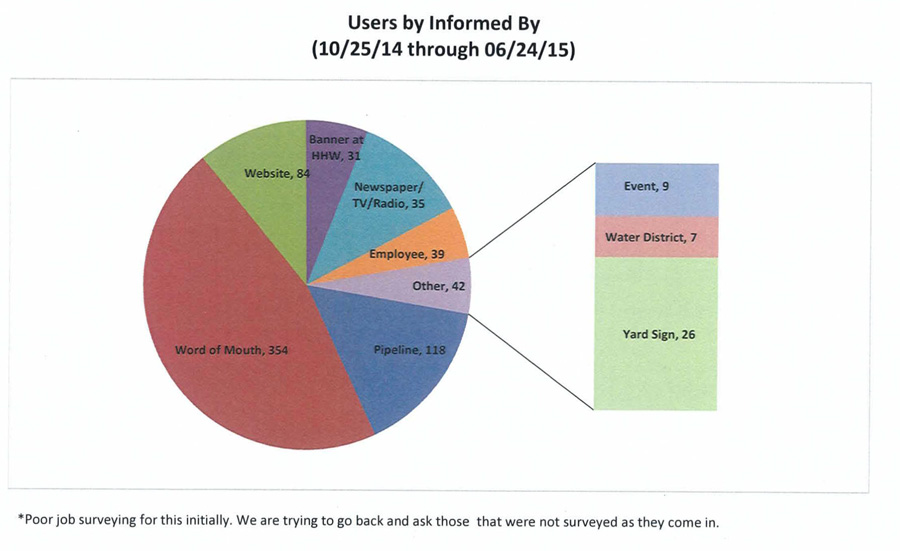
Sixth: Users by Informed By
- How did people hear about the residential fill station?
- 354 people heard about it by word of mouth. I hope its because people saw it on this blog or Facebook. But that would probably be the 84 in the website category.
- 118 people found out from the Pipeline. That must be their government mandated mailer they send out quarterly. Yup. Nailed it!
- 26 people found out from the Yard Sign. Thats all? The people who walk my street talk about it all the time, I wonder if they pick up water. I should ask, but then that would be “word of mouth”.
Source: centralsan.org
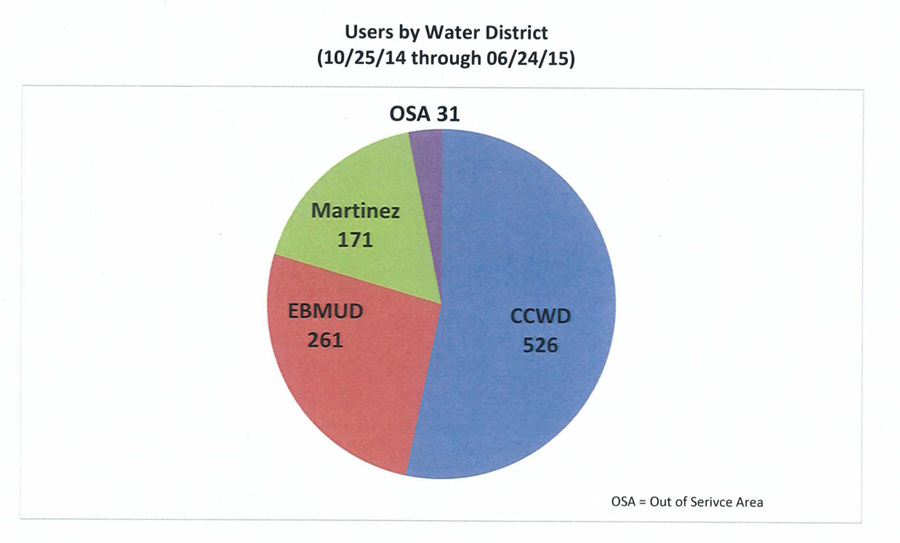
Seventh: Users by Water District
- More than half the registered users hail from the Contra Costa Water District. No surprise there.
- Without knowing how to cut up Walnut Creek or Pleasant Hill, it is difficult to determine what city the 261 EBMUD registered users are, but lets assume they’ve taken 316,000 gallons using some fuzzy math. I welcome that number to be corrected by the folks at CCCSD, leave a comment below. 🙂
Source: centralsan.org
So there you have it, this was hidden in the “General Manager Announcements” under Board Meeting Agenda’s.
Here is the quick link: http://weblink.centralsan.dst.ca.us/WebLink8/0/doc/699700/Page1.aspx
It’s nice to see a public agency that is open and transparent with their information. Keep it up CCCSD!
Note: Below is the chart I made to create the bullet point stats. All data was copied from the bar graphs.
Leave a Reply